by Cody Dumont
December 7, 2020

As the modern vulnerability landscape evolves, organizations are faced with new and evasive threats and vulnerabilities. Any gaps created by vulnerabilities hinder the network's integrity, allowing attackers to gain access to mission critical assets. Once inside the network, an attacker can perform malicious attacks, steal sensitive data, and cause significant damage to critical systems. This report provides a summary of the most prevalent vulnerabilities.
The security operations team is faced with an insurmountable task of creating a list of issues needed to be prioritized. Regardless of whether vulnerabilities are present in user applications, web services, or operating systems, each vulnerability poses risk and should be assessed according to the local guidelines and policies. This report provides a summary of the top 25 vulnerabilities and a list of IP addresses that are associated with the vulnerabilities. Analysts are provided this information to establish a basic ranking of all vulnerabilities. The information is then shared with the risk manager and security director to define the actions needed to mitigate the identified risks.
The report supports filters from the Nessus user interface, which are reflected in the output report. In the Nessus user interface, the analyst can use filters either by host or vulnerability. For example, by setting a filter for hosts that contain “192.168.0.”, the output of the report will be limited to the specified network. This allows risk managers to identify risks based on subnet or other data attributed collected by Nessus. This report template is available for Nessus Professional PDF or HTML reports.
Tenable built the most innovative vulnerability scanner, Nessus, which is the world's most widely deployed vulnerability assessment scanner. Powerful and flexible to adapt to the unique requirements of today's modern networks, Nessus provides visibility into a wide range of assets on many computing platforms. The data in this report provides a detailed of risks based on vulnerabilities and the hosts where they occur.
This report contains the following chapters:
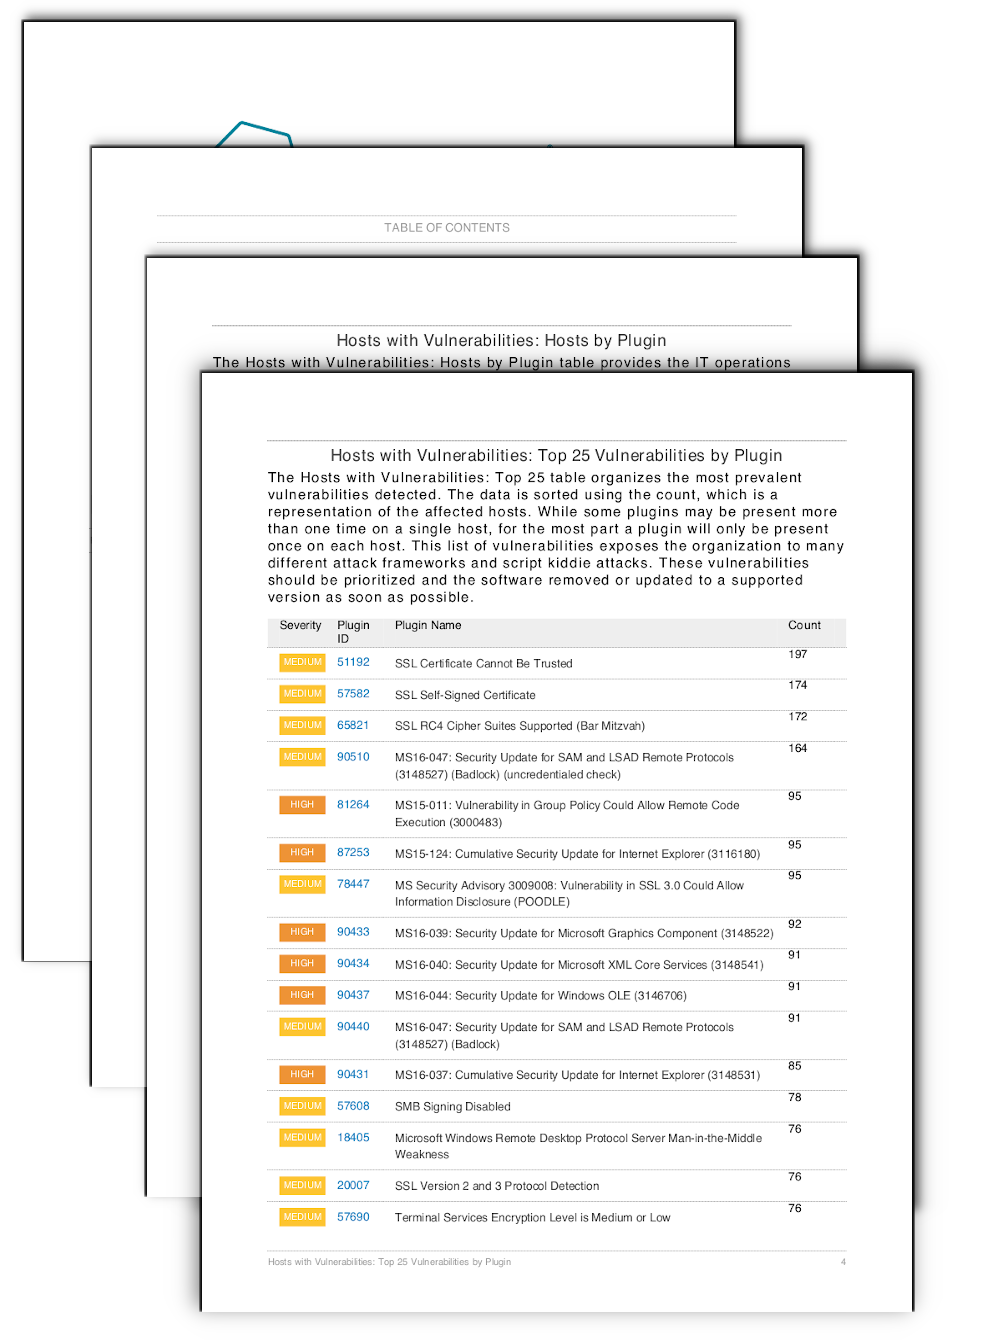
Hosts with Vulnerabilities: Top 25 Vulnerabilities by Plugin table organizes the most prevalent vulnerabilities detected. The data is sorted using the count, which is a representation of the affected hosts. While some plugins may be present more than one time on a single host, a plugin is usually present only once on each host. This list of vulnerabilities exposes the organization to many different attack frameworks and script kiddie attacks. These vulnerabilities should be prioritized and the software removed or updated to a supported version as soon as possible.
Hosts with Vulnerabilities: Hosts by Plugin table provides the IT operations team with an action plan and the identified hosts for each vulnerability. IT managers can use this information to plan patch deployments and work with the information security team on risk mitigation efforts. The table provides all detected vulnerabilities and sorts the scan results using severity, then plugin ID. The entries in the "Hosts" column are then sorted in ascending order.