by Cody Dumont
April 4, 2022

System administrators are typically overloaded with work, making the prioritization of remediation efforts difficult. This dashboard helps prioritize remediation by presenting multiple lists of top hosts in various categories, such as top assets with exploitable vulnerabilities. The widgets on this dashboard leverage vulnerability scan information from Tenable.io, providing a comprehensive and integrated view of the network to help system administrators make the best prioritization decisions for remediation efforts.
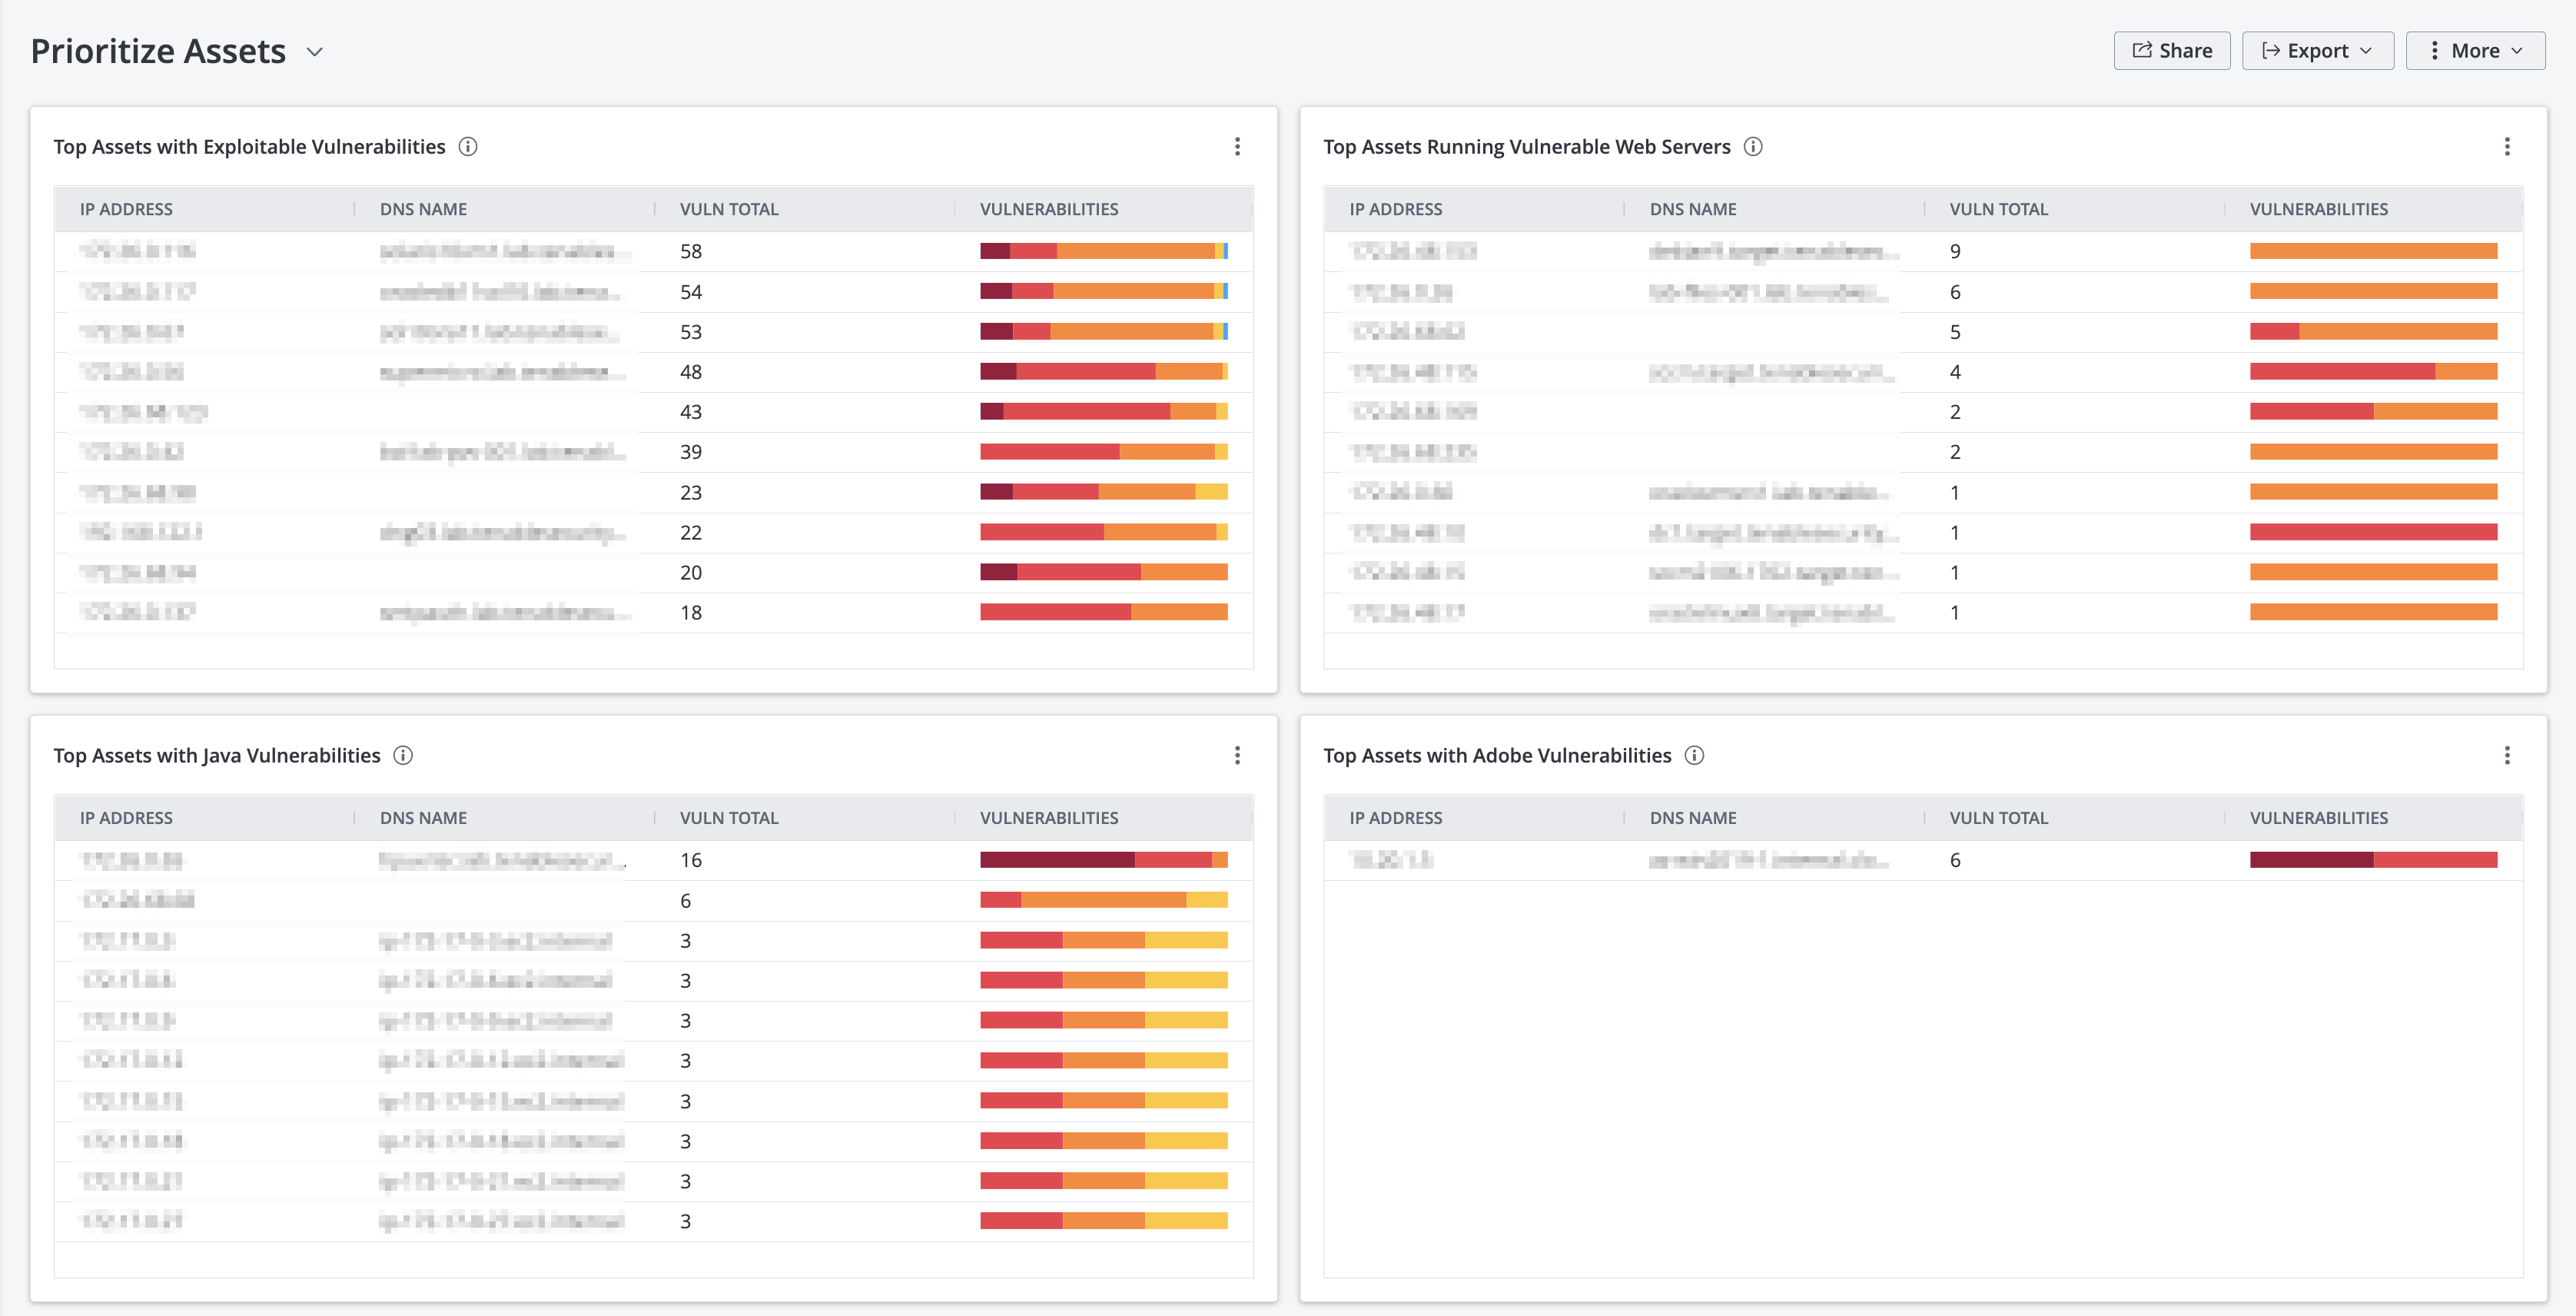
Security managers are often responsible for translating a mountain of security data to determine the organization’s risk exposure. This dashboard presents four tables that displays the most vulnerable systems as determined by different metrics. Each table displays the vulnerability summary for each asset and is sorted using total vulnerabilities. The tables first examine assets by detecting which assets are exploitable, followed by web services and, finally, with two tables focusing on vulnerabilities in common desktop applications. This overall view provides risk managers and system administrators with a list of systems that require an immediate focus, and provides leadership with comprehensive Top 10 lists.
This data presented closes the gap in awareness for the security team and enable system administrators to properly plan and prioritize patch cycles and coverage in mitigation strategies. The security team can add target groups to the dashboard template, allowing different asset managers to prioritize remediation efforts on the risk to their specific areas of concern. System administrators can take the same dashboards as actionable items to help set the priority of corrective actions and mitigation strategies. Overall, this dashboard is beneficial to several groups within the organization to reduce cyber risk.
Security leaders need to SEE everything, PREDICT what matters most and ACT to address cyber risk and effectively align cybersecurity initiatives with business objectives. Tenable.io discovers and analyzes assets continuously to provide an accurate and unified view of an organization’s security posture.
Widgets
Top Assets with Exploitable Vulnerabilities - This widget table displays the top assets that have the most severe exploitable vulnerabilities. The list is sorted so that the most vulnerable asset is at the top. A count of exploitable vulnerabilities and a bar graph indicating the severity of the vulnerabilities are provided for each asset. The IP address, DNS name, total count, and a vulnerability bar are displayed for each asset. Use this widget to determine the most vulnerable assets on the network.
Top Assets Running Vulnerable Web Servers – This widget includes a summary of the top assets running vulnerable web servers. Vulnerabilities are detected both actively and passively. Data is filtered using the Web Servers plugin family, and is sorted so that most vulnerable web server is at the top. The IP address, DNS name, total count, and a vulnerability bar are displayed for each asset. Use this table to determine the assets running the most vulnerable web servers on the network.
Top Assets with Java Vulnerabilities - This widget presents an overview of the top assets that have actively or passively detected Java vulnerabilities. Data is filtered using the keyword “java” to find plugins that detect Java vulnerabilities. Information is sorted so that most vulnerable asset is at the top, and includes IP address, DNS name, total count, and a vulnerability bar for each asset. Use this table to determine the assets with the most Java vulnerabilities on the network.
Top Assets with Adobe Vulnerabilities - This widget displays the top assets on the network that have detected Adobe vulnerabilities. The list is sorted so that the host with the most critical Adobe vulnerabilities is at the top. A count of vulnerabilities and a bar graph indicating the severity of the vulnerabilities are provided for each asset. The Plugin Name is set in the component filter to the 'adobe' keyword to find plugins that detect Adobe vulnerabilities. Use this table to determine the assets with the most Adobe vulnerabilities on the network.