by Megan Daudelin
September 3, 2015

Identifying methods of ingress into the network via wireless access points is crucial to maintaining a successful security program. This includes monitoring the deployment and status of authorized wireless access points as well as maintaining security by identifying rogue or unauthorized wireless access points. By knowing the wireless vulnerabilities that the network is susceptible to and the potential points of ingress, analysts can focus mitigation efforts in order to effectively harden the network against wireless vulnerabilities.
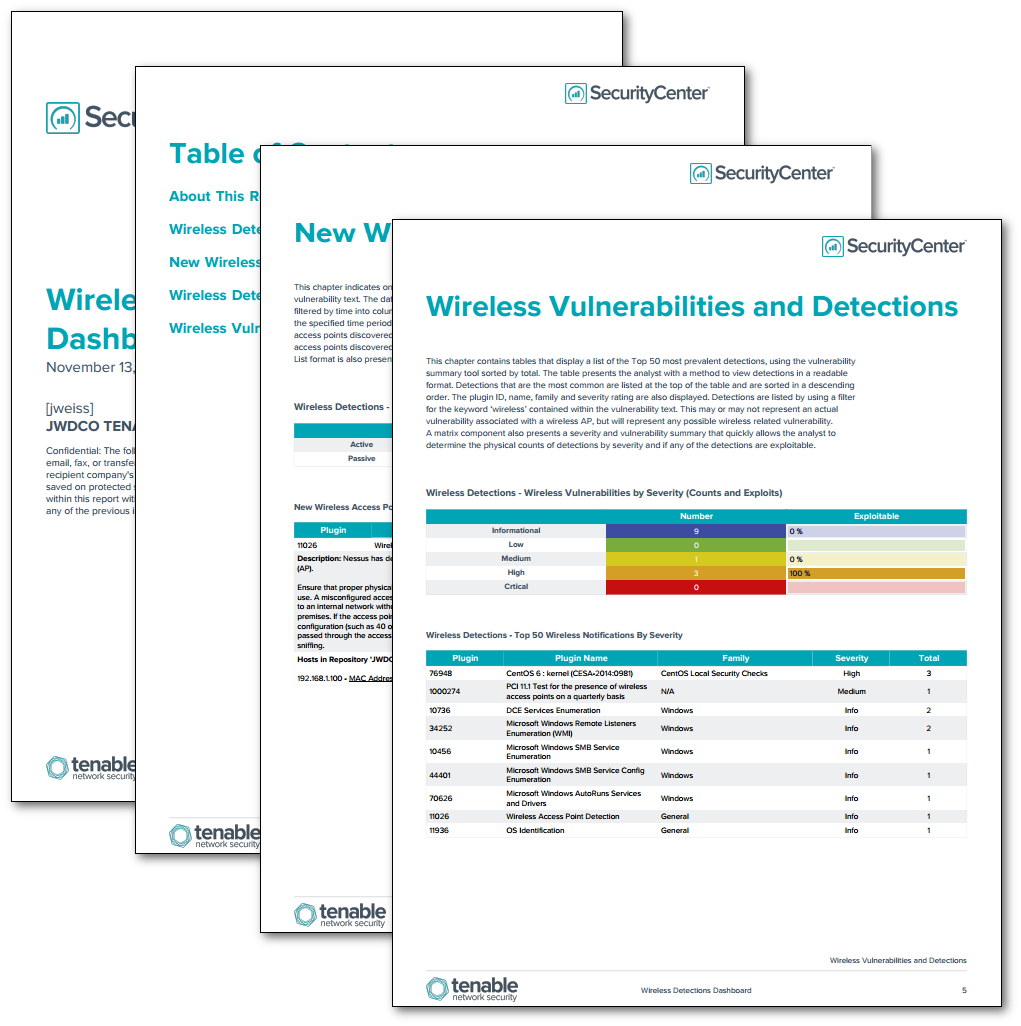
The Wireless Detections Report utilizes both active and passive methods to identify wireless access points and vulnerabilities found within the environment. A series of charts, tables, and matrices are used to illustrate detected wireless points of ingress and vulnerabilities. Trend data about wireless access point and vulnerability detections helps to convey the effectiveness of security measures over time. A section regarding CAPWAP protocol shows whether it is in use on the network and provides information about associated devices. This report also presents details and remediation recommendations for detected wireless vulnerabilities, which helps analysts to identify the most effective hardening and mitigation measures.
The report is available in the SecurityCenter Feed, a comprehensive collection of dashboards, reports, assurance report cards and assets. The report can be easily located in the SecurityCenter Feed under the category Discovery & Detection.
The report requirements are:
- SecurityCenter 4.8.2
- Nessus 5.2.7
- PVS 4.0.3
- This report requires “Full Text Search” to be enabled for each analyzed repository.
SecurityCenter CV scales to meet future demand of monitoring virtualized systems, cloud services, and the proliferation of devices. Nessus is continuously updated with information about advanced threats and zero-day vulnerabilities, and new types of regulatory compliance configuration audits. PVS provides deep packet inspection to enable discovery and assessment of operating systems, network devices, hypervisors, databases, tablets, phones, web servers, cloud applications, and critical infrastructure. Combined, SecurityCenter CV’s continuous network monitoring is able to detect systems, applications, software, and events across the enterprise.
Chapters:
- Executive Summary:This chapter provides an overview of the wireless security status of the network. The first component is a line chart that depicts a 3-month trend of wireless vulnerabilities detected on the network. The second component is a matrix showing the mitigation status of vulnerabilities by severity.
- Wireless Detection Overview:This chapter displays a trend graph over the last 25 days of all wireless access points detected actively or passively. Filtering is accomplished by plugin ID and vulnerability text, for both passive and active detections, over a 24-hour period trending for 25 days. Spikes in trend activity for active detections usually depict when active Nessus scanning on the network has occurred, while passive detections occur immediately when devices are detected by the Tenable Passive Vulnerability Scanner. Also included are detections by count of wireless access points detected by active scanning, and the table presents the count by Class C address space. This table quickly allows the analyst to determine the physical counts of wireless access points by Class C address space within the organization. This allows the analyst to determine if any access points are outside any specified address space.
- New Wireless Access Points:This chapter indicates on triggers from active and passive detection plugins by plugin ID and vulnerability text. The data displays the number of wireless access points detected over time. Indications are filtered by time into columns for the last 24 hours, last 7 days, and last 30 days. If no indication is present for the specified time period, zero (0) is shown. If an alert is present, the indication changes to the number of access points discovered. A table containing additional details in a Vulnerability Summary - IP List format is also presented to provide expanded details.
- Wireless Detections (CAPWAP):This chapter indicates on triggers detecting CAPWAP within the environment. CAPWAP (Control and Provisioning of Wireless Access Points) is a Cisco protocol that allows access controllers or CAPWAP servers to manage wireless termination points or CAPWAP clients over a network. If an alert is present, the indicator changes to purple. A matrix table and Vulnerability Summary - IP List format is also presented to provide expanded details.
- Wireless Vulnerabilities:This chapter contains tables that display a list of the Top 50 most prevalent detections, using the vulnerability summary tool sorted by severity. The table presents the analyst with a method to view detections in a readable format. Detections that are the most common are listed at the top of the table and are sorted in a descending order. The plugin ID, name, family and severity rating are also displayed. Detections are listed by using a filter for the keyword ‘wireless’ contained within the vulnerability text. This may or may not represent an actual vulnerability associated with a wireless AP, but will represent any possible wireless related vulnerability. A matrix component also presents a severity and vulnerability summary that quickly allows the analyst to determine the physical counts of detections by severity and if any of the detections are exploitable.