Implementing network security tools is only the first step in securing an organization. Tools that are not implemented properly or utilized effectively are a waste of time, money, and network resources. Determining whether tools are performing their expected functions is key to understanding whether a network is effectively secured. By leveraging the capabilities of Tenable.sc, Nessus, the Nessus Network Monitor (NNM), and the Log Correlation Engine (LCE), security teams can more easily monitor the effectiveness of their Tenable products and quickly identify the top vulnerabilities detected by each appliance.
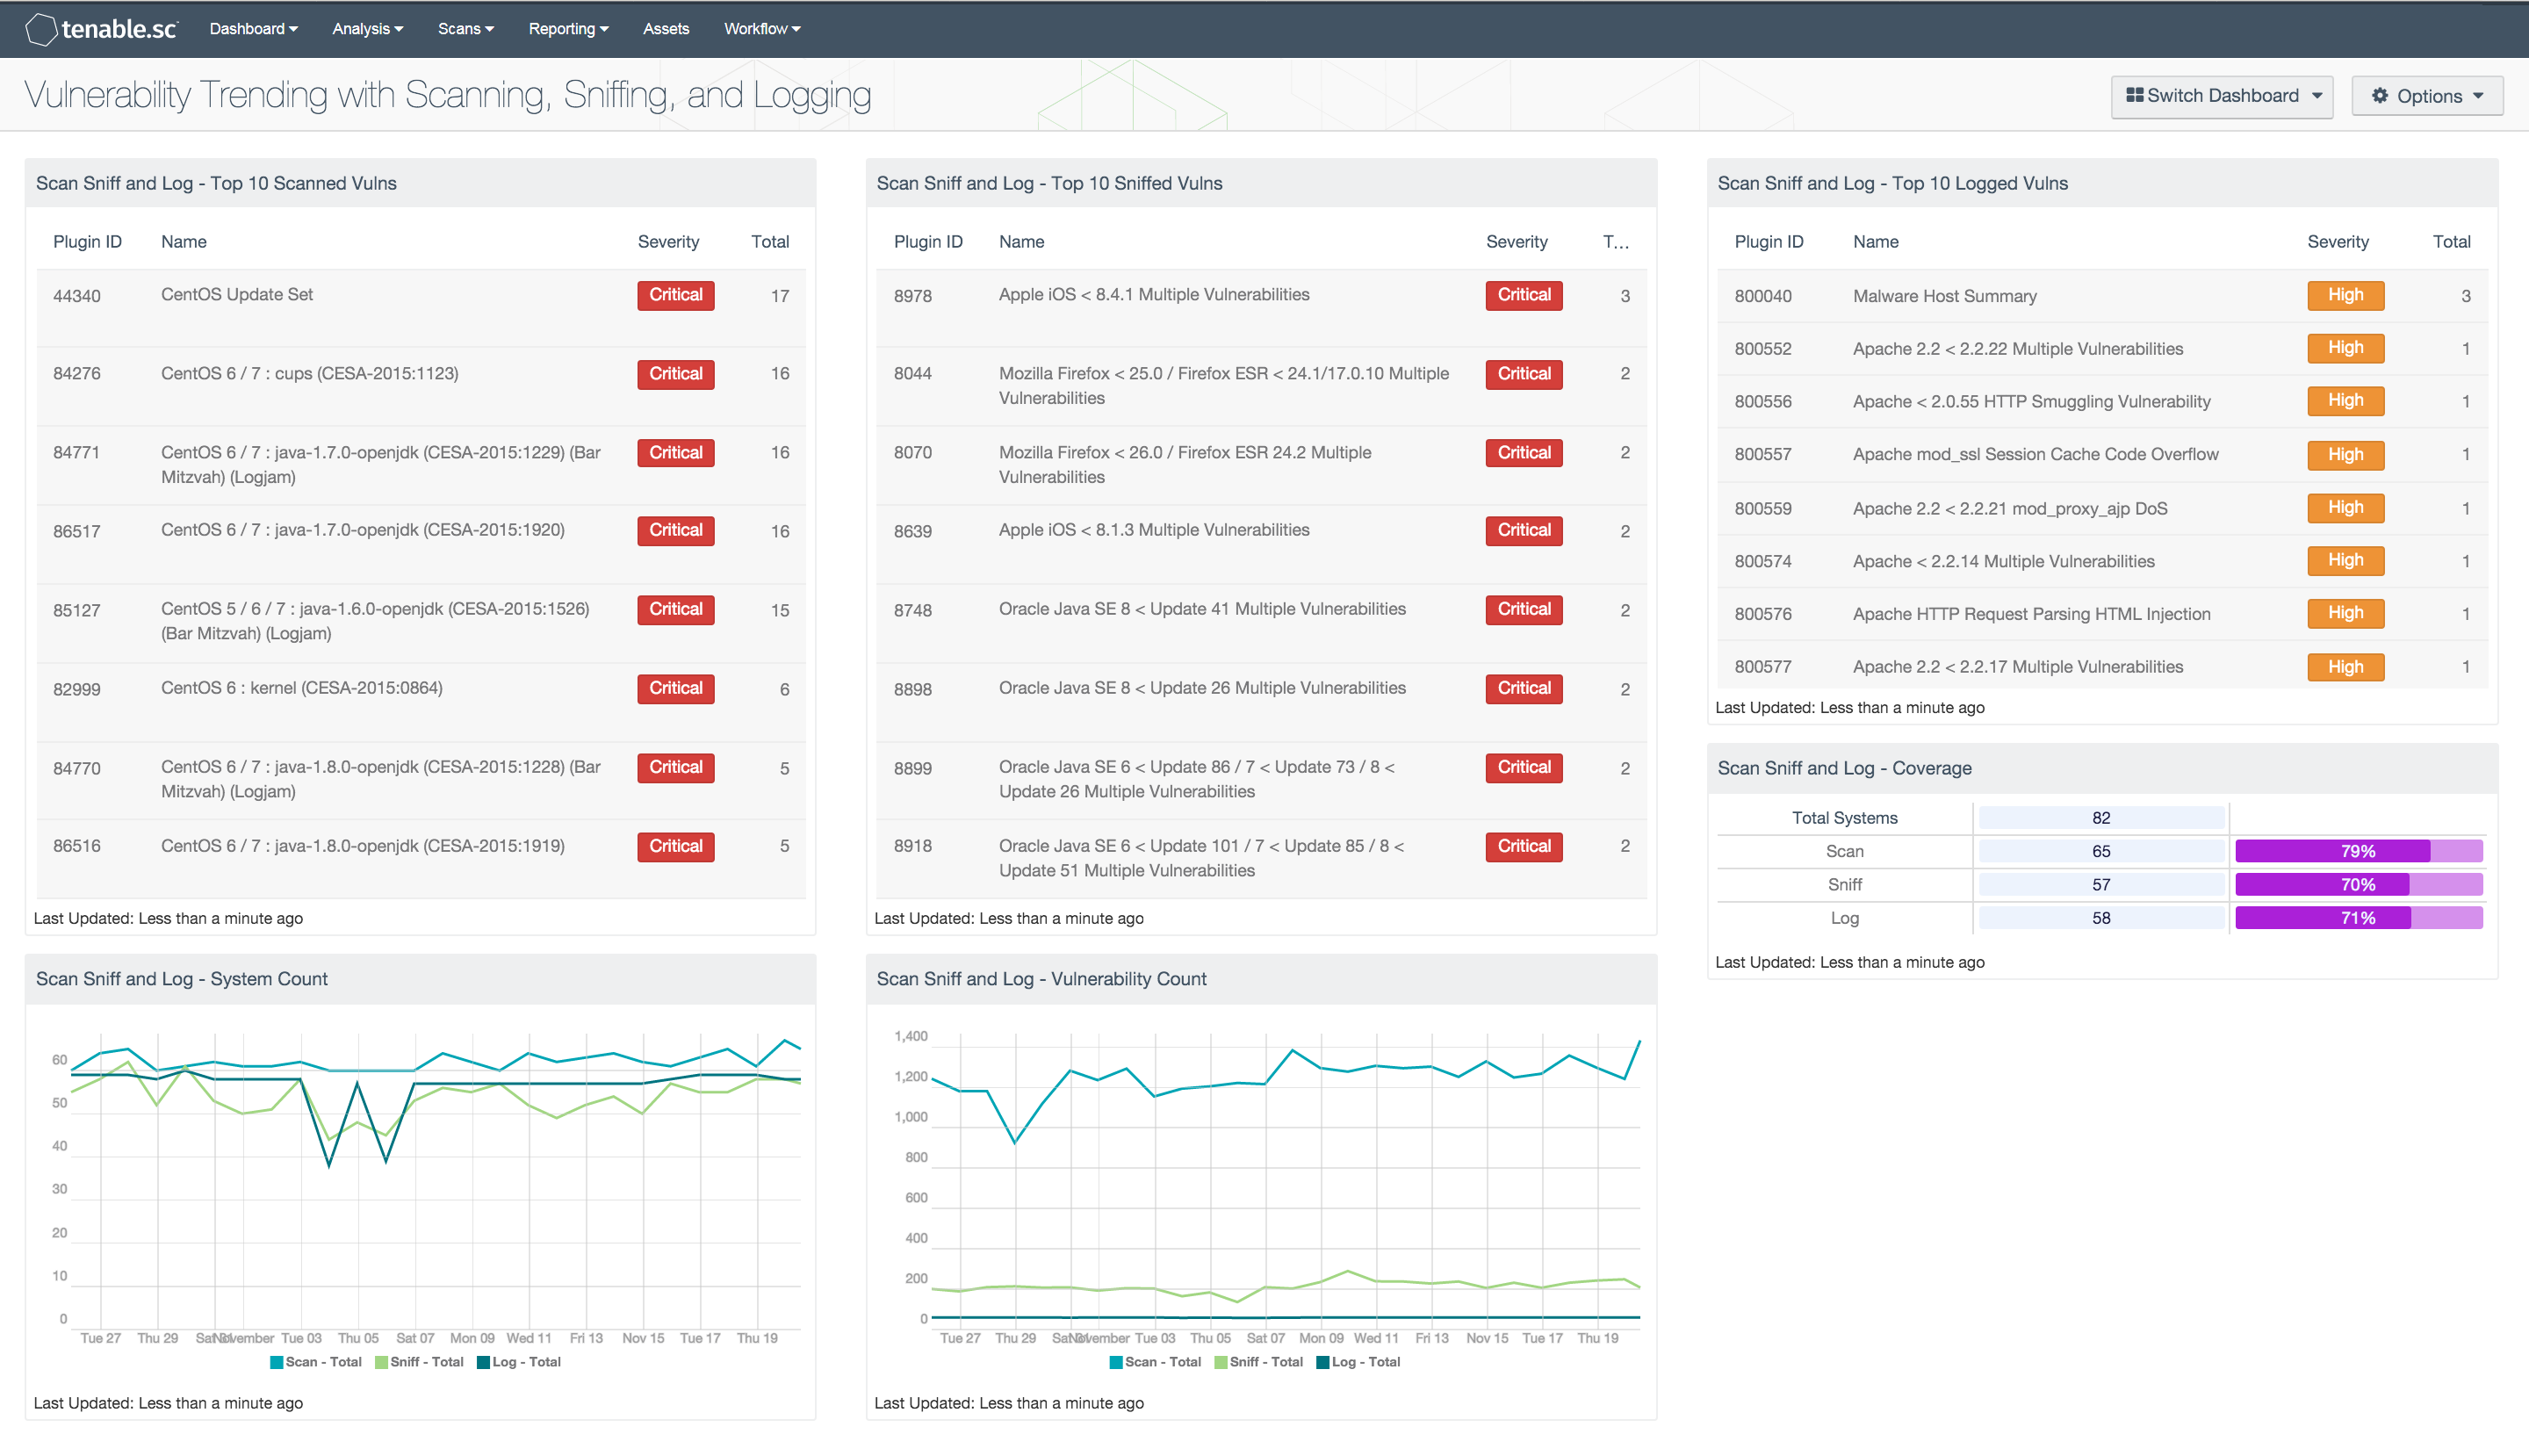
The Vulnerability Trending with Scanning, Sniffing, and Logging dashboard provides high-level information about the detections by an organization’s Tenable products. The dashboard is focused on the detection trends of three plugin types: Active, Passive, and Event Vulnerabilities. These plugin types are referred to in this dashboard as scan, sniff, and log, respectively. Detections of systems and vulnerabilities are analyzed for each type. Additionally, this dashboard contains information about the top severity vulnerabilities for each detection type.
The components in this dashboard provide information about the trends of detections by type, as well as a brief summary of the top vulnerabilities for each type. Each component focuses on a specific topic: system detections, vulnerability detections, or top vulnerabilities. In the detections components, specific plugins and plugin types are used to filter results from Nessus, NNM, and LCE. Trend data for each detection method is charted over 25 days and can be used to monitor the functionality of each tool. Tables listing the top 10 vulnerabilities by severity detected by each type provide an overview of the vulnerability status of the network. Security teams can use these components to better understand the effectiveness of, and justification for, their Tenable products.
This dashboard is available in the Tenable.sc Feed, a comprehensive collection of dashboards, reports, assurance report cards and assets. This dashboard can be easily located in the Tenable.sc Feed under the category Monitoring. The dashboard requirements are:
- Tenable.sc 4.8.2
- Nessus 8.4.0
- NNM 5.9.0
- LCE 6.0.0
Tenable's Tenable.sc Continuous View (CV) provides continuous network monitoring, vulnerability identification, risk reduction, and compliance monitoring. Nessus is continuously updated with information about advanced threats and zero-day vulnerabilities, and new types of regulatory compliance configuration audits. The Nessus Network Monitor (NNM) performs deep packet inspection to enable discovery and assessment of operating systems, network devices, hypervisors, databases, tablets, phones, web servers, cloud applications, and critical infrastructure. The Log Correlation Engine (LCE) performs deep log analysis and correlation to continuously discover and track systems, applications, cloud infrastructure, trust relationships, and vulnerabilities. By integrating with Nessus, NNM, and LCE, Tenable.sc CV’s continuous network monitoring is able to detect systems and vulnerabilities across the enterprise.
This dashboard contains the following components:
- Top 10 Scanned Vulnerabilities: This component displays the top vulnerabilities by severity detected by Nessus.
- Top 10 Sniffed Vulnerabilities: This component displays the top vulnerabilities by severity detected by NNM.
- Top 10 Logged Vulnerabilities: This component displays the top vulnerabilities by severity detected by LCE.
- System Count: This chart displays the trend of discoveries of unique systems by Nessus, NNM, and LCE over the past 25 days.
- Vulnerability Count: This chart displays the trend of discoveries of medium, high, and critical vulnerabilities by Nessus, NNM, and LCE over the past 25 days.
- Coverage: This component displays the total counts of systems being scanned, sniffed, and logged, and the percentages of systems covered.
Tenable One
Request a demo
The world’s leading AI-powered exposure management platform.
Thank You
Thank you for your interest in Tenable One.
A representative will be in touch soon.
Form ID: 7469
Form Name: one-eval
Form Class: c-form form-panel__global-form c-form--mkto js-mkto-no-css js-form-hanging-label c-form--hide-comments
Form Wrapper ID: one-eval-form-wrapper
Confirmation Class: one-eval-confirmform-modal
Simulate Success