by Cody Dumont
January 21, 2021

Each day, risk managers work to identify new vulnerabilities that could place their organizations at risk. 2020 was a challenging year as organizations were required to quickly adapt to new technologies and practices. Tenable.sc provides the data which allows the risk manager to reflect on the mitigation efforts across the entire year. This dashboard takes a look back at the vulnerabilities and threats that made 2020 one of the most active years for security teams in recent memory. Tenable's SRT team continuously works to help organizations to prioritize and create remediation plans for the new threats, which often leaves very little time for reflection. This dashboard takes a moment to leverage "Tenable's 2020 Threat Landscape Retrospective" guide to identify any of the most notable vulnerabilities that were discovered in 2020.
The dashboard leverages CVE filters to display the top 5 threats, and then provides indicators for all remaining threats identified in 2020. As the guide brings to the surface, organizations must continuously look to resolve vulnerabilities that were identified in previous years, while addressing a CVE growth rate of 36.6% in 2020. The fact that for the last three years Tenable has seen over 16,000 CVEs reported annually reflects a new normal for vulnerability disclosure. Risk managers leverage Tenable.sc to prioritize the mitigation efforts using data displayed in this dashboard.
This dashboard is available in the Tenable.sc Feed, a comprehensive collection of dashboards, reports, Assurance Report Cards, and assets. The dashboard can be easily located in the Tenable.sc Feed under the category Security Industry. The dashboard requirements are:
- Tenable.sc 5.9.0
- Nessus 8.13.1
The SRT works to dig into technical details and test proof-of-concept attacks when available to ensure customers are fully informed of the risks. The SRT also provides breakdowns for the latest vulnerabilities on the Tenable blog. Tenable Research has released over 150,000 plugins and leads the industry on CVE coverage. Tenable provides customer with a complete Cyber Exposure platform leveraging the over 150,000 plugins and most complete CVE coverage in the industry.
Components:
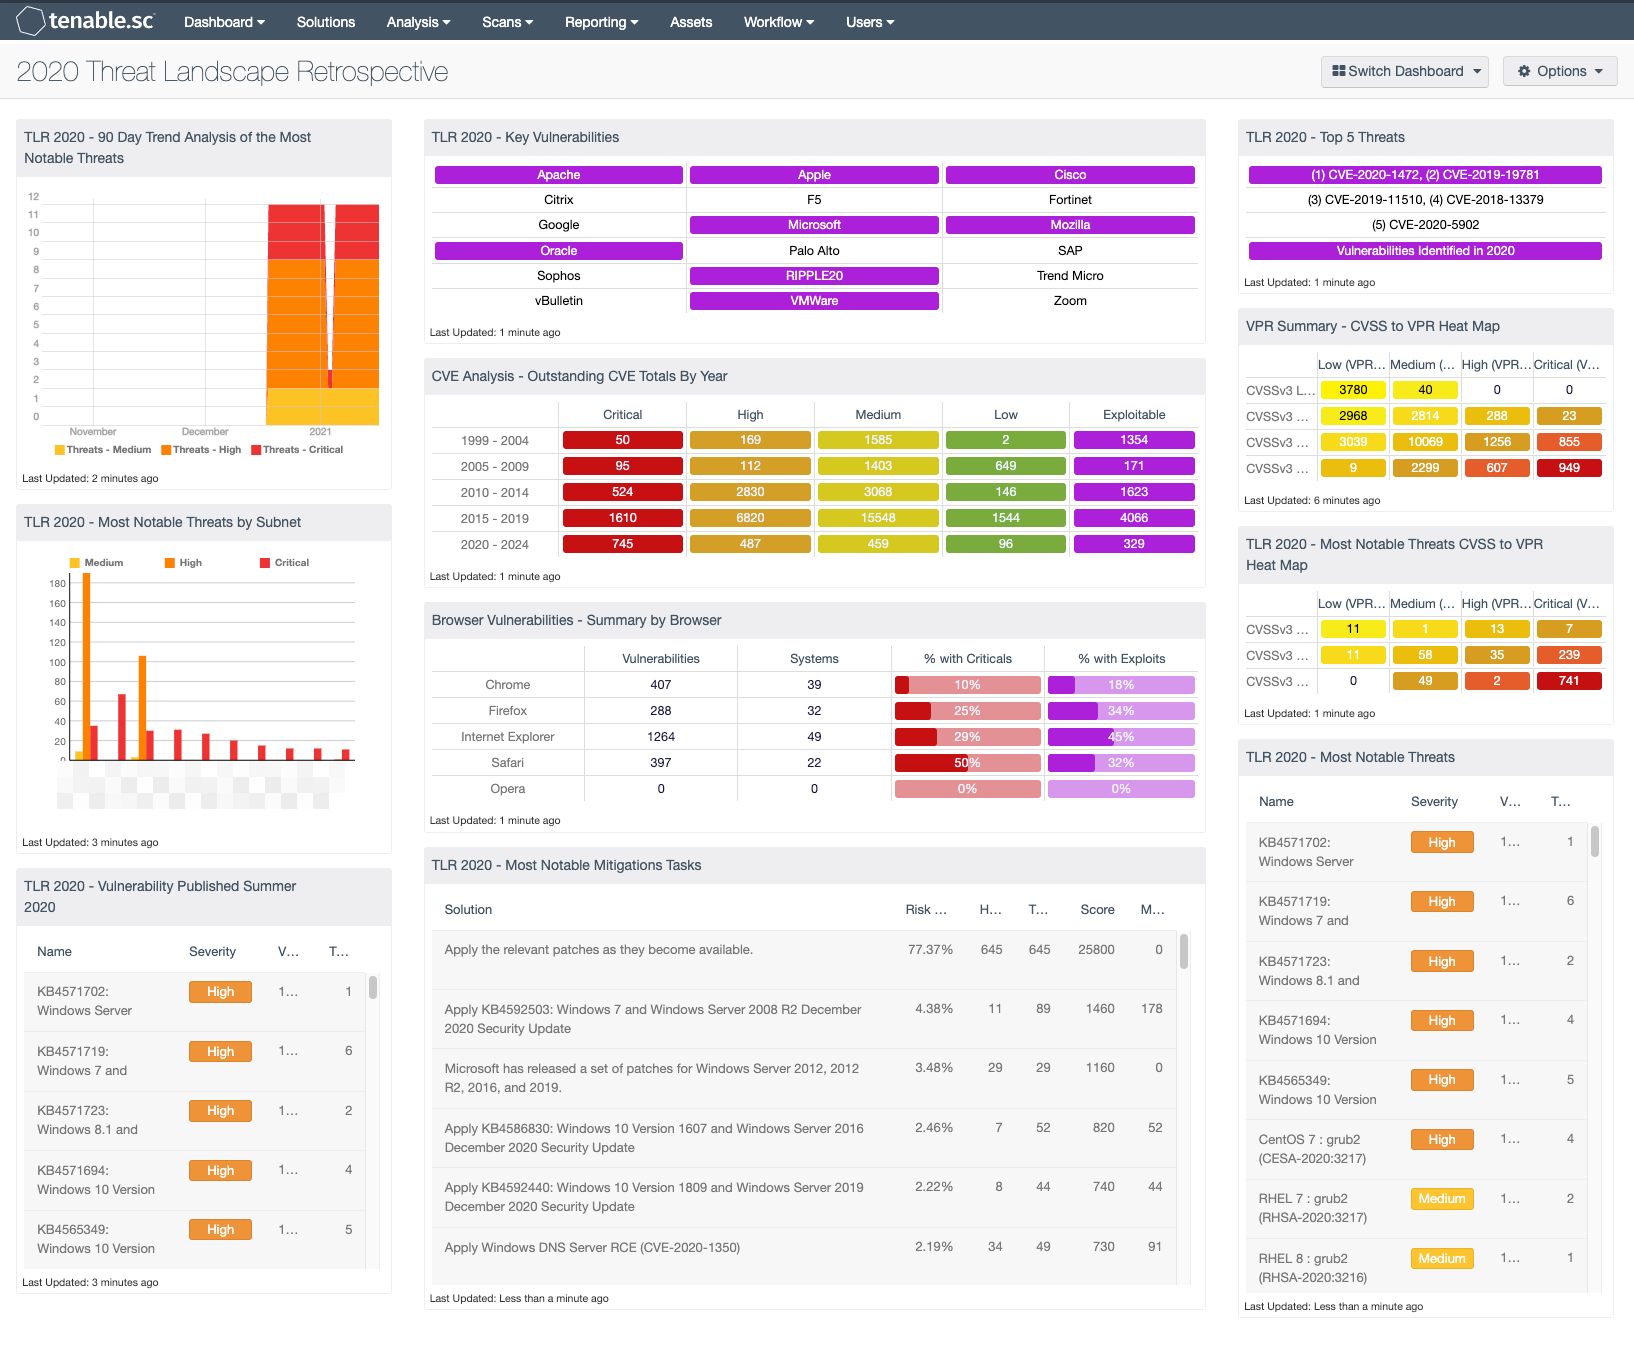
- TLR 2020 - 90 Day Trend Analysis of the Most Notable Threats - This trend graph provides a 90 day analysis of the most notable cybersecurity threats in 2020. By leveraging the CVE’s identified in "Tenable's 2020 Threat Landscape Retrospective" guide.
- TLR 2020 - Most Notable Threats by Subnet - This bar chart provides an analysis by subnet for the most notable cybersecurity threats in 2020. By leveraging the CVE’s identified in "Tenable's 2020 Threat Landscape Retrospective" guide.
- TLR 2020 - Vulnerability Published Summer 2020 - Summer 2020 saw 547 vulnerabilities disclosed, including a number of critical vulnerabilities over the course of a three-month period, creating challenges for IT administrators and staff tasked with triaging patching priorities as they sought to protect their organizations from a barrage of new threats.
- TLR 2020 - Key Vulnerabilities - This matrix provides indicators for a list of vendors which have 2020’s most significant vulnerabilities. Details can be located in the "Tenable's 2020 Threat Landscape Retrospective" guide.
- CVE Analysis - Outstanding CVE Totals By Year - This matrix provides a breakdown by CVE year and severity. The filters used in each cell contain the CVE identifier strings for the year that the CVE was identified and cross-mapped to a severity level. The last column checks for vulnerabilities that are known to be exploitable. The exploitable column is purple, and other columns map the colors to severity: red is critical, orange is high, yellow is medium, and green is low. The last row filters for CVEs through 2024.
- Browser Vulnerabilities - Summary by Browser - This matrix displays summary information by major web browser for vulnerabilities actively and passively detected on the network. (Rows for additional web browsers can be added as desired.) The total count of vulnerabilities is displayed, indicating whether the browser is being used on the network and the vulnerabilities present. The count of vulnerable systems and the percentages of those systems with critical and exploitable vulnerabilities are also displayed. These critical and exploitable vulnerabilities are the highest priority to remediate. Clicking on an indicator will bring up the vulnerability analysis screen to display details on the vulnerabilities. In the vulnerability analysis screen, setting the tool to IP Summary will display the systems on which the vulnerabilities are present.
- TLR 2020 - Most Notable Mitigations Tasks - This table provides list of patches that will mitigate the most notable cybersecurity threats in 2020. By leveraging the CVE’s identified in "Tenable's 2020 Threat Landscape Retrospective" guide.
- TLR 2020 - Top 5 Threats - The top 5 vulnerabilities of 2020 feature some of the most widely used and discussed CVE's of the year. This matrix provides the CVE’s and all vulnerabilities released in 2020.
- VPR Summary - CVSS to VPR Heat Map - This component provides a correlation between CVSSv3 scores and VPR scoring for the vulnerabilities present in the organization. The CVSSv3 scores are the traditional method of analyzing risk, while VPR is a new method based on data science analysis and threat modeling. Each cell is comprised of a combination of cross-mapping of CVSS & VPR scoring. Using a heat map approach, the filters begin in the left upper corner with vulnerabilities with the least risk. Moving to the right and lower down the matrix the colors change darker from yellow to red as the risk levels increase. Customers should mitigate risks in the lower right corners, and then work towards the upper left cells.
- TLR 2020 - Most Notable Threats CVSS to VPR Heat Map - This component provides a correlation between CVSSv3 scores and VPR scoring for the vulnerabilities using the 157 CVEs discussed in the 2020 TLR.
- TLR 2020 - Most Notable Threats - This table provides list of the most notable cybersecurity threats in 2020. By leveraging the CVE’s identified in "Tenable's 2020 Threat Landscape Retrospective" guide.