by Stephanie Dunn
May 20, 2016
Network statistics provide valuable information that can be often overlooked. Statistics events provide a baseline of normal network traffic, and can alert to deviations such as user behavior, trust relationships, and security policy changes. This dashboard presents a comprehensive look at statistical network events, and will assist the organization in identifying any major network event changes throughout the enterprise.
As hosts connect and communicate, changes in network activity can go unnoticed. Having a continuous monitoring policy in place can identify activity such as increased network connections, brute force login attempts, and other types of malicious activity. Increased connection activity from multiple hosts could mean connections to malware command and control servers, or suspicious files that may have been downloaded. In addition, this activity could also indicate data being exfiltrated to an external host outside the network. These event changes can provide organizations with valuable information on the health of network devices, and whether existing security policies need to be strengthened.
This dashboard provides organizations with a centralized view of statistical anomalies on the network. The Log Correlation Engine (LCE) ‘stats’ daemon studies existing network behavior each hour of each day, and provides a baseline of normal traffic events for that host. Both network and client/server connections are tracked, and alerts if any significant changes or deviations have been observed. For example, for a given host, if the LCE detected a large spike in the frequency of the ‘PVS-Web_Query_Yahoo_Search’ event, it would issue a ‘Statistics-Social_Networks_Large_Anomaly’ event. Knowing when major changes occur can help to eliminate security weaknesses within the network, as well as improve overall security posture.
This dashboard is available in the SecurityCenter Feed, a comprehensive collection of dashboards, reports, Assurance Report Cards, and assets. The dashboard can be easily located in the SecurityCenter Feed under the category Monitoring. The dashboard requirements are:
- SecurityCenter 5.3.2
- LCE 4.8.0
SecurityCenter Continuous View (CV) provides organizations with proactive continuous monitoring to identify the newest threats across the entire enterprise. LCE actively monitors and correlates real-time events, and has the capability to identify malicious activity and anomalous behavior from users, operating systems, network devices, hypervisors, databases, tablets, phones, web servers, and other critical infrastructure. By integrating LCE with SecurityCenter CV’s continuous network monitoring, organizations will be able to detect events and vulnerabilities across the enterprise.
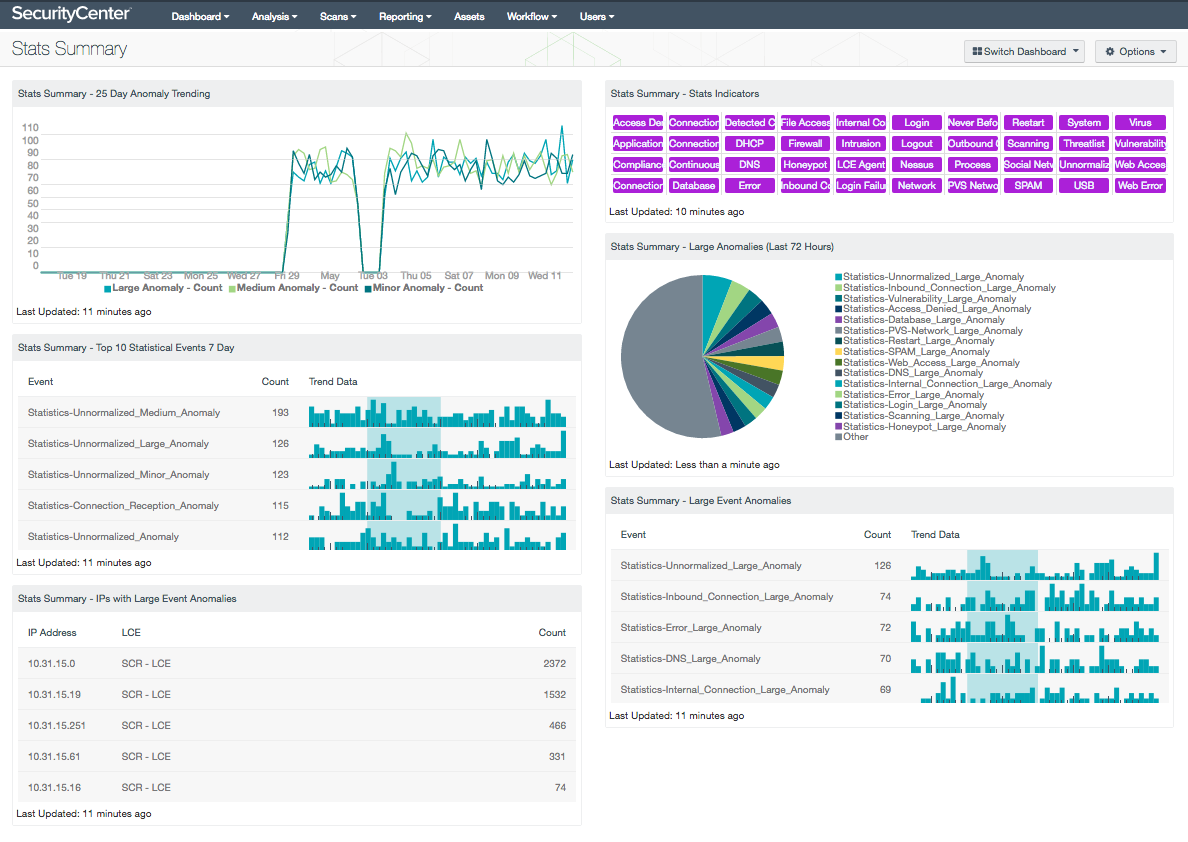
The following components are included in this dashboard:
- Stats Summary - 25 Day Anomaly Trending: A minor anomaly would be considered to have between 1.0 and 5.99 units of standard deviation, while a medium anomaly would have between 10.0 and 99.99 units of standard deviation. A large anomaly would have between 100.0 and 999999.99 units of standard deviation. The formula for standard deviations is explained further in the Log Correlation Engine 4.4 Statistics Daemon Guide available on the Tenable Support Portal.
- Stats Summary - Top 10 Statistical Events 7 Day: This component shows all statistical anomalies ordered by count over a 7 day period. This component doesn’t consider the size of the anomaly, but shows the number of anomalies in a descending order.
- Stats Summary - IPs with Large Event Anomalies: This component shows which IP addresses were associated with large anomalies over a 7 day period, and will order them by count in a descending order.
- Stats Summary - Stats Indicators: This dashboard component shows the 40 different types of anomalies that the statistics daemon monitors. If there is one or more events for each of the anomalies monitored, it will be indicated in this component.
- Stats Summary - Large Anomalies (Last 72 Hours): This pie chart shows all of the large statistical anomaly events that occurred in a 72 hour period. An example of a large anomaly: A system typically has 10 outbound connections per day plus or minus 2 connections. The mean would be 10, and the standard deviation would be 2. Subsequently, if there were 210 connections, a large anomaly would be triggered, because the sample is 100 standard deviation units from the statistical mean. The formula for standard deviations is explained further in the Log Correlation Engine 4.4 Statistics Daemon Guide available on the Tenable Support Portal
- Stats Summary - Large Event Anomalies: This component will show events that are related to large anomalies on the network. The inbound, outbound, and internal connections are tracked day to day by the stats daemon. Client and server connections are also monitored by the stats daemon. If there are any large anomaly related events, they will be shown in this component. An example of a large anomaly would be a network node that typically has 10 failed logins per day, plus or minus 2 failed logins. The mean would be 10, and the standard deviation would be 2. If that node then had over 210 login failures, a large anomaly would be triggered, because the sample is 100 standard deviations from the statistical mean. The formula for standard deviations is explained further in the Log Correlation Engine 4.4 Statistics Daemon Guide, available on the Tenable Support Portal.